
If you have stayed with the series till now, well done! You did better than me, as I needed couple of distracting posts in-between 🙂 This will, hopefully, be the last of this series unless I find something else not covered elsewhere.
Over the first 5 articles, we analyzed dividend investing vs. index investing from various points of view. We saw that dividend growth investing (DGI) isn’t so drastically different from a comparable equity index investing. We also saw how our ageing investor Charlie can have his DGI cake and eat it too! We learned that dividend income is a major component of total return even if you are an indexer. The current income flexibility of the DGI approach versus the ‘buy and forget’ nature of Indexing are just some of the relative advantages each investing philosophy has. We also saw that index lag risk, while real, is subject to investor psychology and can apply to both indexers and DGIers. For many people, income during retirement is more important than maximizing portfolio value on the day they die.
Indexing and DGI are both good approaches to equity investing.

Both DGI and Indexing are good paths to making real money.
The biggest benefits of indexing are great diversification and market-assured total returns for very little effort – it is truly ‘buy and forget’ type of investing. The downsides are high market volatility and lumpiness in passive dividend income, and reliance on statistical safe withdrawal rate (SWR) studies based on a single point of starting portfolio value. These negatives are to be weighed against the substantial positives of indexing.
In DGI, the benefits are stable and growing passive income to support retirement fully without having to sell any stocks, so you can meet the income needs throughout retirement and still leave a legacy. The biggest benefit is customization of income (within reason) to suit the needs of each investor. The downside is, DGI is more of a ‘buy and monitor’ type of investing. Still, a DGI portfolio can be structured to have lower volatility than the market. Generally, there isn’t much to monitor if the original purchase is a high quality dividend-growing company with a sound business model, bought at a good valuation. Another tangible benefit is that there is normally a significant increase in passive income with a DGI strategy compared to pure indexing (for the same portfolio size), so it’s like higher income now vs. potentially higher portfolio value later.
Indexing means whatever dividend income the market gives now while capturing the highest growth possible of the broad market. So, there are compromises in both. It is entirely possible that a DGI portfolio can beat the index over a long period, just as it is possible for the opposite to happen. However, if the portfolio construction is proper, the out-performance or under-performance of a DGI portfolio versus a truly comparable index ETF would not be by much. This is where DGI is very different from momentum, technical or other speculative stock picking approaches.
Is it possible to combine the best of indexing and DGI?
Yes. That’s what we will attempt here. There are now exchange-traded funds (ETFs) available that replicate the principles of sound dividend growth investing. There are also broad criteria-based stock ETFs focused on dividends. The relative maturity of U.S. based dividend ETFs versus international is one reason why I prefer to remain an indexer for international markets. It is possible to also be a strict dividend investor for international and emerging markets, but due to exchange rate considerations and the fact that not many international companies follow a dividend growth policy (many have a fixed dividend policy), the benefits of DGI would not be so apparent. To get the best of both worlds, indexing for international and dividend for domestic may serve investors well. I for i and D for d, if you will. 🙂
If you believe in the principles and benefits of DGI and yet are unwilling or unable to do the diligence to acquire a DGI portfolio over time, you can consider an ETF portfolio along these lines below. I present some model portfolios for both DGIers and Indexers to consider. All portfolios are 100% equity and well-diversified. Remember, diversification is good but within limits. There is no safety in high numbers as all stocks are subject to market volatility – A 3000 stock index isn’t necessarily ‘safer’ than a 3o-stock well-constructed DGI portfolio with industry leading companies across multiple sectors. In fact, it is possible to construct a 30-stock portfolio using low volatility companies (‘defensive’ stocks), which is ‘safer’ than the S&P 500 index. I will cover this in a future article. Just to be clear, by ‘safer’ here, I specifically refer to lower decline than the index during bear markets. No stock portfolio, DGI or index, can be immune to bear markets.
In estimating dividend income for the following portfolios, I have considered $1 million portfolio size, but this works for any size of portfolio – just scale the numbers proportionally.
Portfolio 1. Dividend & Index Combination Portfolio (Mixed Funds)
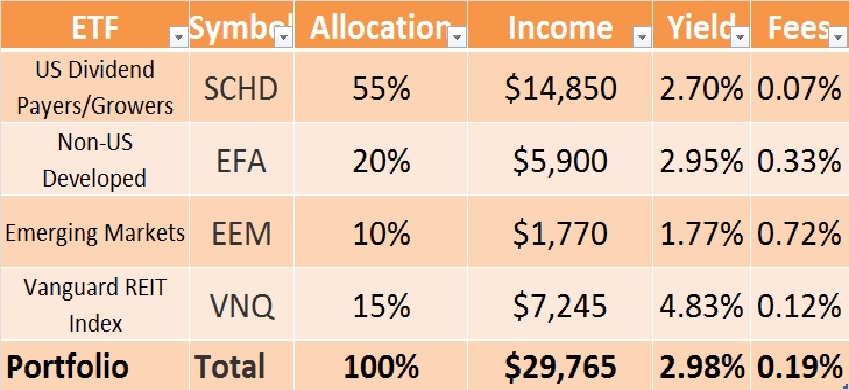
This portfolio will deliver almost a 3% yield (at recent prices), and has a low expense ratio of 0.19%. This dividend stream of nearly $30K will grow over time, though the growth rate is not as predictable as in a company-specific dividend growth portfolio. Notice a separate allocation for real estate investment trusts (REITs), as SCHD doesn’t include REITs. It is an important sector not only for higher dividends, but also for good diversification of the portfolio.
Portfolio 2. Dividend & Index Combination Portfolio (for Vanguard diehards)
As a pioneer of low cost investing, Vanguard offers two good dividend-oriented ETFs for US investors. One is VIG and the second is VYM. I prefer VYM as it is broader and covers more sectors, though it may have a bit less of a growth rate than VIG.
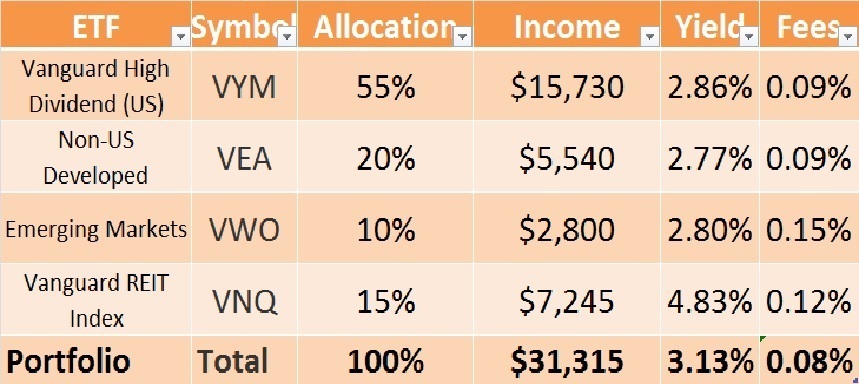
Not only does this portfolio deliver higher income, the costs of running this portfolio is half that of Portfolio 1, at just 0.08%. Notice a separate allocation for real estate investment trusts (REITs), as VYM doesn’t include REITs. With this portfolio, you get the benefits of indexing with a dividend tilt. This may appeal to those who want to stick only with Vanguard funds.
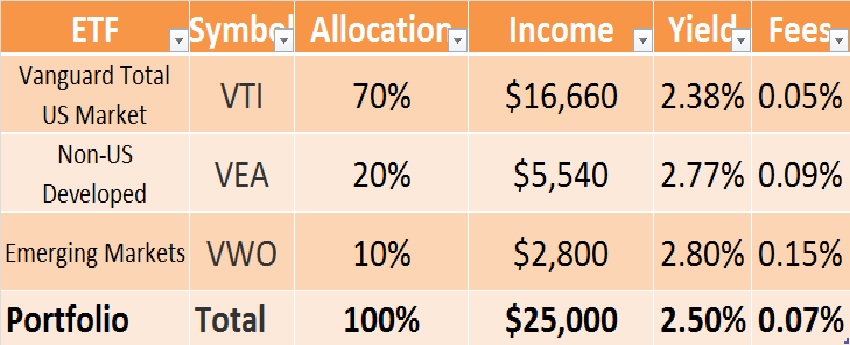
Portfolio 3. Equivalent Index Portfolio
This is a simple but globally diverse Vanguard index portfolio, which is a benchmark for the above two portfolios. Notice this doesn’t have a separate allocation for REITs because VTI includes all the stocks traded in the US market, including REITs. This has almost the same cost as Portfolio 2, but this offers 25% less dividend income.
Takeaways
Both portfolios 1 and 2 offer a higher dividend yield than the equivalent index portfolio (Portfolio 3). If this dividend yield is still not sufficient, you can always supplement by selling an additional amount to meet your spending needs. For example, if you want $36,000 in income for the first year from the portfolio, you will sell shares worth $11,000 in the index Portfolio 3 (as the first $25,000 is provided by dividends). For the same $36K in income, you only need to sell $4,685 worth of shares in Portfolio 2 and $6,235 worth of shares in Portfolio 1. In reality, a diversified DGI portfolio can be constructed to deliver a 3.6% yield so that no sale of shares are needed to sustain your living expenses of $36,000.
These portfolio examples were created to show how you can get the benefits of dividend investing while maintaining the same simplicity of an equity index portfolio. As I said before, there is nothing wrong with indexing strategy but equivalent strategies having a dividend tilt (to take advantage of Ned Davis Research we cited in Part 1) can be considered by investors who choose not to select individual stocks.
The price you pay for this convenience is fees. Self-directed DGI investors will point out that even 0.08% fees of a $1 million portfolio costs $800 annually, which will only increase as the portfolio does. At $8 a trade (or less) in many discount brokerages, that’s equivalent to 100 trades in a year. At 0.19%, the fees is $1900 or over 230 trades in a year. A DGI portfolio, once constructed carefully, will need far less churn, possibly just a couple of trades a year (that too, only if warranted). So, DGI can actually be much lower cost for a larger portfolio (<0.01%, for a $500K+ portfolio) than even indexing.
While we barely touched on it, taxes also play a considerable role in considering DGI vs. Indexing approach. U.S., Canada and a few other countries are places where dividends and capital gains are favorably taxed compared to earned income. In the U.S., a couple filing their tax returns under ‘married filing jointly’ status using standard deductions can effectively shield over $80,000 in annual dividends and capital gains from federal taxes – in effect, they pay no federal tax if they have no other income. If they also happen to live in states that follow this principle, they will pay zero taxes on this entire $80K income! Also, what counts for this total is only from taxable accounts – the dividends and capital gains in tax-advantaged accounts (like IRA, 401(k)s) don’t count for taxable income. The U.S. taxation structure clearly supports a dividend-oriented investment approach.
Whether pure DGI or pure indexing or a combination of both – you can achieve your financial goals if you stick with your investing strategy, especially when the going gets tough (which the market will test you, periodically).
With this, we will end the comparative investing series here. Hope you have enjoyed reading this series. I also hope you will use the right investing strategy that best appeals to your interest and long-term goals. I would always appreciate your feedback and comments.
Raman Venkatesh is the founder of Ten Factorial Rocks. Raman is a ‘Gen X’ corporate executive in his mid 40’s. In addition to having a Ph.D. in engineering, he has worked in almost all continents of the world. Ten Factorial Rocks (TFR) was created to chronicle his journey towards retirement while sharing his views on the absurdities and pitfalls along the way. The name was taken from the mathematical function 10! (ten factorial) which is equal to 10 x 9 x 8 x 7 x 6 x 5 x 4 x 3 x 2 x 1 = 3,628,800.
12 comments on “Dividend Investing vs. Indexing – Part 6”