

How was your first date?

My first date movie experience? As memorable as this.
Using a retirement calculator for the first time is somewhat like going out on a first date.
It is a rite of passage on your journey towards financial independence, much like the first date is a prelude to an enduring relationship. It explores sides of you that didn’t know existed! Were you a clumsy, bumbling teenager who wanted the first date to be over with really fast?
I was happy to get the dinner over with (the pizza was yummy but the company was not). I painfully sulked in my seat as some terrible movie (not my choice, obviously) was on, while slowly munching from a large bowl of popcorn. I don’t even remember the movie name now.
Like the first retirement calculator.
Retirement Calculators – Can’t live with them or without them
That experience is somewhat akin to my first time use of an internet retirement calculator, probably the first ever retirement calculator on the net.
I think it was at a CNBC website right around the time such calculators were born and had barely 4 data fields before it spit out the answer. I am talking about the pre-dot com era, long before sophisticated retirement calculators based on Monte Carlo simulation or back-tested real data started appearing.
The comparison is like an IBM monochrome PC to today’s super fast graphics chip powered loaded laptop.
Much like a clumsy teenager, I was quick to try it and when faced with a result I didn’t like, I forgot about it and didn’t call on the site ever again. That was when my net worth was in 4 figures. I remember being depressed about the result that the retirement calculator spit out.

Like today’s retirement calculators. Hack-worthy.
Today’s calculators are a class apart. While there are some good calculators on fund management sites (Vanguard, Fidelity, T. Rowe Price websites for example), there are two that particularly stand out for the aspiring financially independent or early retirement (FIRE) community.
These calculators are particularly good from the perspective of comprehensive historical database, ease of use and wide input flexibility for scenario analysis. I am specifically referring to FIRECalc and cFIREsim.
Still, we should remember these calculators rely on historical performance to make projections. Keeping the adage past performance is not predictive of future results, how do we coax valuable information out of them, particularly at the time of historically low bond yields?
Most people do the analysis over the past 30, 40 or even 50 year horizon for a conventional 60/40 portfolio of stocks and bonds. In that entire time period nowhere have the bond yields been this low as we are seeing now. Some say we have experienced a generational bull market in bonds that is finally showing signs of cracking.

Hack your way to more money in retirement.
In this backdrop, how do we reliably use the retirement calculators? By hacking them, of course!
Hack the calculator to your advantage.
Relax with a nice cuppa as we look into this simple but incredibly effective way to calm your retirement nerves in current times.
The first hack we will do is to eliminate bonds from analysis. By defaulting to a 100% equity portfolio analysis, we eliminate the entire question surrounding the historically unique bond market today. So, how do we correct for the fact that many portfolios have bonds?
Well, we don’t!
This is where Hack #2 comes in. By demanding a very high probability of success, we force the calculator to come up with the lowest possible spending rate. This takes care of the bond allocation in these low yield times (up to 30% bond allocation, based on my analysis. A 80/20 portfolio behaves practically the same as 100% stock).
Since the current stock valuation is still within the range of historical P/E ratios, by demanding a very high (98-100%) probability of success, you force the calculator to become conservative. This serves as a proxy for the relatively high stock market valuations.
Hack #3 is to ignore Social Security or even pensions (unless you are absolutely sure of getting it). Retirement calculators consider these ‘guaranteed’ income streams as direct offset against withdrawals, so the moment you enter a pension or SS, your safe withdrawal amount shoots up considerably.
If you have a fixed withdrawal target, your probability of success catapults much higher. By eliminating this factor, you are making an indirect allowance for a high P/E ratio of current markets in the calculations and getting to the truly safe withdrawal rate from your portfolio.
Let’s see an example. We will calculate the safe withdrawal rate (SWR) for a 50 year retirement horizon that gives 100% chance of success for a $1 million, 100% equity index portfolio invested at a very low 0.1% annual expense ratio with the assumption of no social security or pension.
With these hacks, cFIREsim reports $32,752 as the maximum initial spending possible. This works to a 3.27% withdrawal rate in the first year of retirement. My fellow blogger Early Retirement Now has published a large series of posts analyzing the SWR under various scenarios.
This simple hack we did brought us to essentially the same conclusion that ERN arrived at after massive amount of analytical work (which is commendable, and worthy of a university thesis).
What does this mean?
We should remember that we did these hacks with the sole purpose of finding the edge of the failure scenario. Put another way, this gives you a truly ‘safe’ withdrawal rate for the first year of retirement, assuming the worst historical case scenario, as a conservative proxy for current relatively high stock valuations.
But that’s all you should treat these results as – don’t read too much into them. Don’t get enamored with the median or max portfolio values from this simulation – you will notice that they are very (possibly, unrealistically) high.
This is because they are an artifact of the 100% equity portfolio assumption we deliberately made to capture the widest possible swing in portfolio values. The widest swing naturally includes a very low point (at the verge of failure) and a very high point (max value) and several higher value ranges (median and above) of market performance, none of which would apply if your portfolio has bonds or even stocks of different types (sector focus or dividend-focus) than the index.
Even if you don’t hold any bonds, I would treat the higher portfolio values with a big pinch of salt because this simulation doesn’t correct for current stock valuation. Therefore, the most useful result from these hacks is the ‘lowest point’ (or failure edge) of SWR, which is converged by the 100% success probability we demanded at the start.
That SWR is 3.27% – which is where you can start your first year withdrawals at. Notice how this is considerably lower (18.25% lower, to be precise) than the famous 4% rule.
With this ‘safest’ case now done, you could relax the success probabilities down and calculate SWR (keeping all other variables the same as above). Doing that gives me these results below (for the same example):
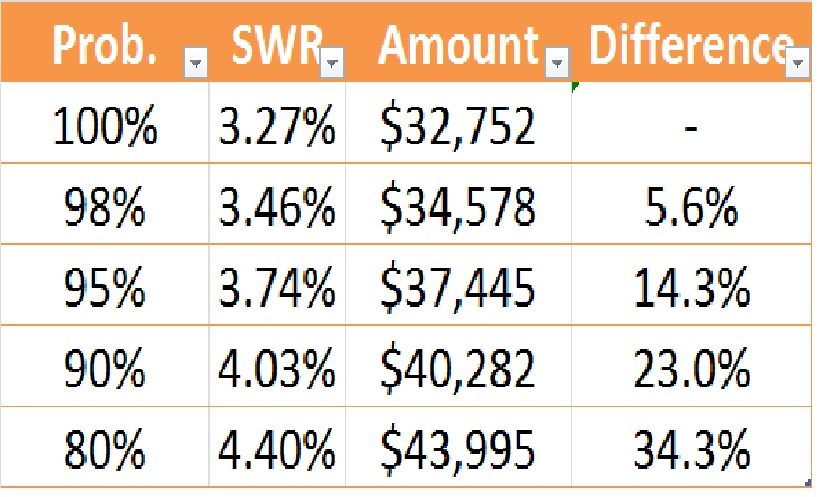
SWR reduces with increasing probability of success. I know, right?
We saw in an earlier article how the probability of success in a retirement calculator is not a guaranteed way to retirement success, given the complex reality of our lives.
Even Burton Malkiel, the author of the famous book, A Random Walk Down Wall Street, says that once you cross 80% probability of success in such simulations, you are practically good to go because there are so many life variables involved that determine your ultimate success. So, going from 90% to 98% gives a false sense of assurance when the other risk factors become more significant.
With this caveat in mind, see how the SWR varies with the ‘required’ probability of success – a difference of 34% in income from the 100% to 80% case. Even the 14.3% difference between 95% and 100% case is meaningfully large from a spending perspective. That’s almost $5,000 in additional spendable income.
The same table can be interpreted in another way as well. You can also see why any kind of a small, part-time income, or even a modest pension or social security, dramatically improves your probability of success.
If you need $40K to live on, a small side income of $7,500/year or a tiny pension/social security check of $600/month can catapult your portfolio’s success probability from 90% to 100%.
From a one-in-ten chance of failure to a near zero chance of failure! So, don’t get scared by the lower probability of success figures because you are lot more in control of your life than what these retirement calculators assume.
To sum it up…
An objective of this exercise is to hack the retirement calculators to counteract the current scenario of high stock valuations and low bond yields to arrive at a truly ‘safe’ withdrawal rate to ensure your retirement success.
We have achieved that objective and arrived at an SWR that essentially matches a much more complex, analytically rigorous study. Using these simple hacks, we have established that 3.27% as our new ‘safe’ (safest?) withdrawal rate by converting a quirk of a rigorous retirement calculator (that is, assign probability of failure to the ‘edge’ event) to our advantage.
In reality, what’s safe is not a single SWR number – from the above analysis, we can consider the safe range as 3.27%-3.74% because a lot depends on how the portfolio evolves during the first decade of retirement. But remember, the results from the hacks aren’t valid for any other purpose if your actual portfolio has a different allocation.
What do you think? Are you less nervous now about your SWR? Share your feedback below.
Added later: Based on some comments this article received, I think it is useful to add a caution that a retirement calculator based on historical data used with sufficiently conservative assumptions is the closest you will get to estimating your retirement success. Since the market is based on secular trends and is not random (see my reply below in response to a comment on this topic), I would urge you so stay away from Monte Carlo-based simulation. To read an excellent paper on why Monte Carlo simulators aren’t the best tool for retirement planning, see this article by Jim Otar.
Raman Venkatesh is the founder of Ten Factorial Rocks. Raman is a ‘Gen X’ corporate executive in his mid 40’s. In addition to having a Ph.D. in engineering, he has worked in almost all continents of the world. Ten Factorial Rocks (TFR) was created to chronicle his journey towards retirement while sharing his views on the absurdities and pitfalls along the way. The name was taken from the mathematical function 10! (ten factorial) which is equal to 10 x 9 x 8 x 7 x 6 x 5 x 4 x 3 x 2 x 1 = 3,628,800.
23 comments on “Hacking The Retirement Calculators”