The real path. No gimmicks or short-cuts.
My past articles have been on many essential topics relating to life, work, savings and even relationships. Those posts serve as preparatory work for getting into a serious topic in this article – on investing. Before starting on our investing journey, it is clear that we should learn to save more and be sensibly frugal. The next step is to understand what efficient investing is – nobody taught me this but I learned the hard way by making mistakes, which I hope you will avoid. You are smart to learn from my past investment mistakes. Efficient investing is an important concept that will make a huge impact on your future, easily adding over $100,000 to your retirement stash with no effort on your part!
First, kill the management costs
You cannot control investment returns, but you can and must control investment costs. This is a vital part of investing efficiently. As a target, I would recommend that you start with 0.25% of total portfolio as a maximum for expenses. For a $5000 portfolio, this would work to annual investment expenses of just $12.50. Following a ‘traditional’ portfolio of 60% stocks (VTSMX – total stock market index fund) and 40% bonds (VBMFX – total bond market index fund), here’s how the expenses would look.
Stocks: $3,000 invested, expense ratio 0.16%, annual expense: $4.80
Bonds: $2,000 invested, expense ratio 0.16%, annual expense: $3.20
Total: $5,000 invested, annual expense: $8.00 (0.16%).
This is an extremely good starting point (only $8 in annual expenses). If the stock index returns 8% annually over long periods of time, and bonds, let’s say do 4%, then the weighted average return of both at the same 60/40 ratio would be 6.4% (without expenses). Using the above example expenses of 0.16%, the return would be 6.24%. On the other hand, if your portfolio had an average expense ratio of 1.19% as Morningstar’s 2015 research showed, your portfolio return would be 5.21%. This difference adds up to a pretty penny over time. Over a 20-year horizon, $5000 invested in the above index funds in 60/40 ratio would become $16,778. On an average expense ratio of 1.19%, the same money invested over the same period would be worth only $13,807, a loss of $2,971. Put another way, you would end up with 21% more money if you chose the low cost route.
These differences would compound in a way that would make the average cost portfolio far worse if you were putting in money every year. A different formula applies here.
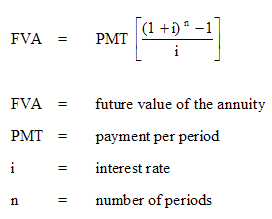
This formula kills your average cost investment.
If you invest $5,000 every year for 20 years, the low cost portfolio would grow to $188,744. In the average cost portfolio, it would grow to only $169,047, a difference of nearly $20,000! For regular savers over longer (30+ year) horizons, the difference can be over $100,000!
So, if you want to take the first step towards efficient investing, costs matter….a lot! How do you figure out these costs? Pay close attention to the items named ‘fees’, ’12b-1′ and ‘management expenses’ in the prospectus of any mutual fund you have put money in. Then, come back to this page and apply the formula above using your annual investment figure as the PMT and i as the annual return minus all listed expenses in your fund details. You won’t know what the returns (before fees and taxes) will be but for the sake of calculating impact, you can assume 8% for an equity fund and 4% for an intermediate-term bond index fund.
Don’t want to do all this? Then, quite simply, take the portfolio expense target I recommended above (0.25%) and make sure all your investments have total expenses at or below this target.
The first step to efficient investing is to kill the costs, and decimate them to insignificance! The percentages may appear small but they are huge in impact – for example, 0.5% is better than 1%, 0.1% is far better than 0.5%, and 0.05% or lower is also possible as you get better at killing costs. The rest of this post would make better sense after you have achieved at least 0.5% or less in annual expenses in your investment portfolio.
Next, get on the efficient frontier express!
Pummeling down your investment costs means you have won most of the battle! Now that you have conquered costs, the next step is to focus on efficient return. This part is often not clear to many but is important to understand. We all know that risk and return are related. Higher risk means higher expected return and vice versa. A lot of studies have been done on the trade-off between risk and return in financial investments, leading to what is called the Efficient Frontier.
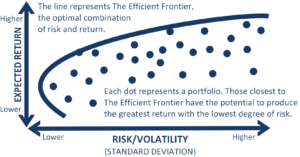
Efficient Frontier: The holy curve of investing!
This is the curve that many financial planners, academics and funds use to analyze where they are in their portfolio. The horizontal axis is Risk (measured as volatility) and the vertical axis is Expected Return (in %age). The extreme top right end of the curve represents a 100% stocks portfolio, one that has the highest risk and also, the highest expected return. Every point along the curve has a decreasing allocation of stocks and increasing allocation of bonds which reduces volatility (‘risk’) but also, reduces expected return. The ‘dots’ below the curve are all less efficient portfolios because for the same level of risk, you can get a better return (or) for the same level of return, you can theoretically take on less risk (volatility).
Notice how the curve bends down and left for the most part but finally curves back a bit? That’s because a 100% bonds portfolio is more risky than a portfolio having 20% stocks and 80% bonds and it also produces lower return. In other words, the curving back part (bottom left) of the efficient frontier curve is actually not efficient. The efficient frontier ends at the point where the risk is lowest, which is roughly equal to 80% bonds and 20% stocks. Staying on the efficient frontier curve is critical to maximizing returns. This is why successful early retirees like Jim Collins suggest putting 80%, if not more, into one Vanguard index fund VTSAX that charges just 0.05% in fees!
Where does cash fit in here? It doesn’t! The moment you hold cash, you move away from the efficient frontier to below the curve, which, by definition, is inefficient. In other words, holding cash makes the investment portfolio less efficient (like one of the dots in the figure). Now, there are good reasons to hold some cash but not as an investment, but perhaps as a small ‘comfort’ holding outside your investment portfolio. Remember cash yields next to nothing so, the ‘comfort’ you seek will be a drag on investment returns. That’s the price you pay for playing safe. This is why fellow bloggers like ERN hold no cash, even as an emergency fund.
Lastly, Got Risk?
100% of TFR family’s investment portfolio is in stocks. Yes, 100%. Isn’t that too risky? Perhaps, if you define risk as the possibility of seeing lower balance in my account next year than now. That’s not how I define risk. A large number of experts in the mainstream finance community have created a huge fear-factor on risk. True risk is not volatility, that is, the day-to-day changes in the stock prices or even year-to-year declines possible in some years (can be as much as 40% during recessions). The real risk is not being able to fully finance your retirement due to increasing costs. The real risk is not recognizing that the 100% stock portfolio gives the highest possible return on the most efficient frontier, and for that, you must learn to deal with wild swings in portfolio value. The real risk is in paying a heavy price at the end for the comfort of having a ‘smoother’ ride during the course of your investment journey. The real risk is in demanding certainty in investments when the whole business world (where most of human effort, efficiency and creativity are employed), by nature, is uncertain. The real risk is not recognizing all that human work to increase business profits has a better chance of succeeding than a fixed return on a guaranteed debt (bond) payment. The real risk is not recognizing that fluctuating dividend income from a gyrating stock portfolio is the price you must pay for a having an inflation-adjusted income source in retirement while ensuring portfolio longevity.
The table below shows the expected return and risk for my portfolio versus the benchmarks. If you notice, despite being 100% in stocks, my portfolio has lower risk than a 100% total stock index (see the Historical Risk column below). For such a large reduction in expected volatility (‘risk’), my compromise in expected return is only 7% (that is, 9.3% expected return vs. 10.02% expected, for 100% stock portfolio). How did I get here even with 100% stock allocation within the efficient frontier? Wait for a future post to describe my investing process in detail!
| Asset Allocation | Historical Return | Historical Risk |
| Current Allocation | 9.3% | 15.8% |
| Target Allocation | 8.7% | 13.6% |
| 100% Bonds | 5.56% | 9.21% |
| 100% Stocks | 10.02% | 19.99% |
This table is automatically and freely available for anyone who uses Personal Capital. If you are still looking for reasons to join, you can read this post or sign-up for free.
What I have summarized in this post is elaborated as a multi-part series on Stock Investing by fellow blogger Jim Collins. It answers just about every question you may have about investing. Read that to get a ground-up perspective on how simple investing is and there is really no excuse get started.
Raman Venkatesh is the founder of Ten Factorial Rocks. Raman is a ‘Gen X’ corporate executive in his mid 40’s. In addition to having a Ph.D. in engineering, he has worked in almost all continents of the world. Ten Factorial Rocks (TFR) was created to chronicle his journey towards retirement while sharing his views on the absurdities and pitfalls along the way. The name was taken from the mathematical function 10! (ten factorial) which is equal to 10 x 9 x 8 x 7 x 6 x 5 x 4 x 3 x 2 x 1 = 3,628,800.
17 comments on “How To Invest Efficiently”