
After last week’s article explored why many multi-millionaires are worried about money, today we focus on another angle. Not exactly millionaires, but affluent retirees are also worried about running out of money. So, they chronically under-spend, leaving big portfolios and delighted heirs behind.
Bloomberg’s article on this subject shared some interesting facts. I will cover some of them and see how we can learn and do better for ourselves.
Many happy heirs
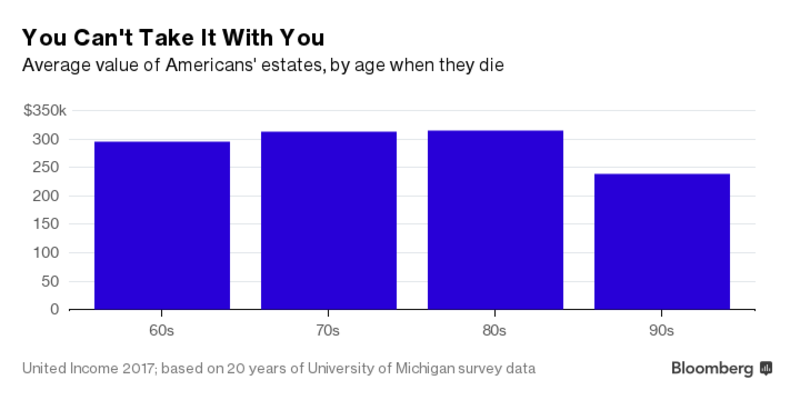
“Rich retirees are hoarding cash out of fear” was the provocative click-bait title that Bloomberg chose. First, there is no hoarding going on. It is a lifetime of savings these diligent folks have accumulated. These aren’t millionaires, with the average ending assets at just about $300,000. Second, media likes to use the word ‘cash’ very loosely. It attracts attention in a headline but offers no useful information. The $300K average refers to total financial assets like stocks, bonds and private investments, and includes some cash, from what I could make out. In other words, it is an investment portfolio of the retiree.
If you apply the 4% SWR – safe withdrawal rate (actually we should apply 5%-6% considering the age of these folks), the average estate balance will generate $12,000 in annual income, that is, an additional $1000 a month. This is a meaningful amount for any retiree, especially someone in their 70’s or 80’s. In the 90’s age range, the average asset size dips, possibly because of expensive terminal health care costs. Some studies estimate that more than half of all the medical expenses of retirees are spent in the last 3 years of their life.
The article goes on to examine the reasons for “hoarding cash” – which is misleading but anyway, the way the question is framed, you will get the answer you are looking for. And they got it…
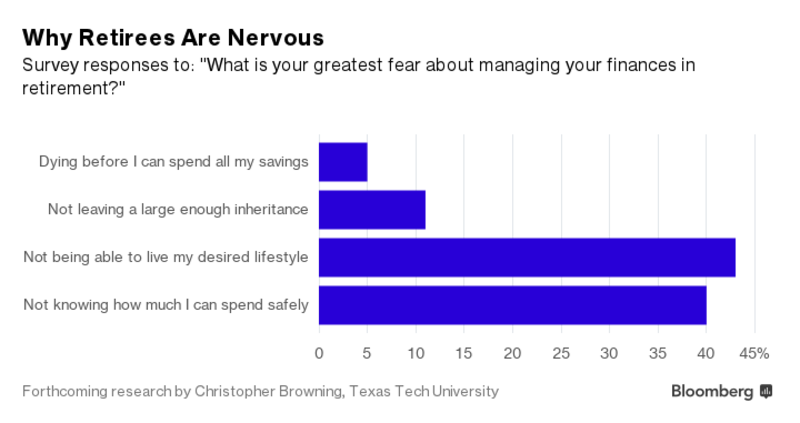
“Not knowing” and “not being able” are big worry factors indeed.
“Not being able to live my desired lifestyle” is actually a sad reason. This means nearly half of the surveyed folks with sizable assets know they can afford to spend more, but are unable to, probably because of either health or other constraints. You cannot fault these folks because life is much more than just retirement spending. There are life events far beyond the control of the even best-laid financial plans that constrain people from spending their hard-earned assets.
The other category “Not knowing how much I can spend safely” being as high as 40% was shocking to me. This represents the real demographic that Bloomberg was attempting to paint in their article. I call this the regret group of retirees.
As FI bloggers/FIRE aspirants, we should all look closely at this group, as this is where we may end up! The high level of conservatism that we show in retirement spending, of which this website is also guilty of, is likely to lead to ending retirement balances far in excess of what the 99% success rates project for a thrifty spending budget. As much as I want to be conservative, I also don’t want to feel regret in the later years wishing I enjoyed life more, listing coulda, shoulda or woulda as I have seen many seniors do. So, I started digging into the details.
Of course, when you are staring at 40 years or more of retirement, it is good to be conservative to begin with. What’s important is to remember that our basis of retirement planning changes as we age and our portfolio grows. For example, a 45-year-old early retiree may plan for another 45 years of retired life and decide to start with a 3.5% SWR, which may be a prudent thing to do. Yet, it is important to check where you are in this life plan periodically. I suggest every 5 years to do a detailed review, besides a quick annual review prior to withdrawing the spending budget from your portfolio.
Let’s do an example to understand this better:
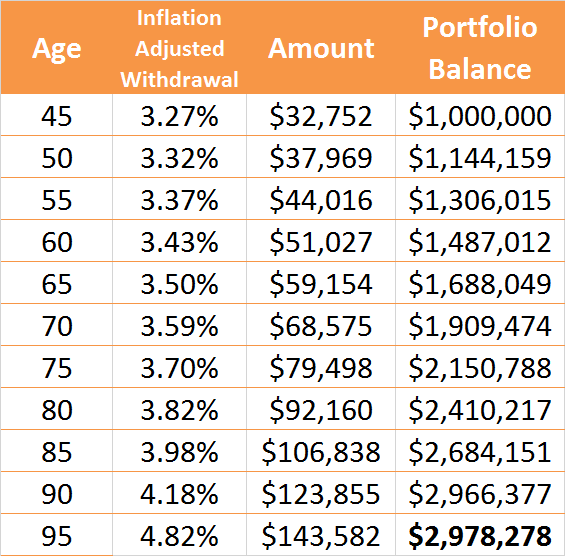
Case: 45-year old early retiree (single or couple), $1 million portfolio, with annual return of 6% over the entire planning horizon of 50 years. Start with really safe withdrawal rate of 3.27%. At 50th year of retirement, ‘end of life’ (EOL) care cost is estimated at $300K. Nobody knows what the right figure is beforehand, but this is just an allowance for the fact that a big chunk of health care costs are incurred in the last year of life. The portfolio balance at age 95 includes this EOL cost, and what is shown as balance at that age is the legacy available for heirs or other bequests.
Our analysis assumes no pensions or social security, which is again very conservative. Even a $8000 (in present value) annual social security or pension can materially improve the longevity of an investment portfolio, especially one that has low withdrawal rates.
A Tale of Two Retired Lives
Scenario 1: Starting with $32.7K withdrawal at first year. Subsequent year withdrawals are inflation adjusted at 3% every year. All other assumptions same as in the Case description above. This is the scenario that leads to the regret group mentioned in the Bloomberg article above. See the table below to learn why.
For the sake of simplicity, I am showing only every 5 years as a reference point in this analysis for an investor to do a reality check.
Reward of Conservative Withdrawals = Delighted Heirs

Reward for maximizing portfolio value?
Despite the 3% raises in withdrawal amounts each year to cover inflation, the investor’s withdrawal rate always remains below the portfolio return rate of 6%. As a result, the portfolio balance is increasing throughout the retirement horizon. This isn’t always such a great thing. I believe this is what causes regret in 80’s or 90’s. For instance, in early 80’s, when the retiree realizes he has over $2.4 million in the portfolio (that is, 2.4 times what he started retirement with) and now regrets not being able to enjoy travel or other pursuits due to health or other constraints.
Scenario 2: Can we improve upon the fate of Scenario 1? After all, having a 50 year retirement, and leaving nearly a $3 million estate for heirs may not be what the retiree had in mind when he/she started. Scenario 1 retiree is part of the regret group that says “Not knowing how much I can spend safely”.
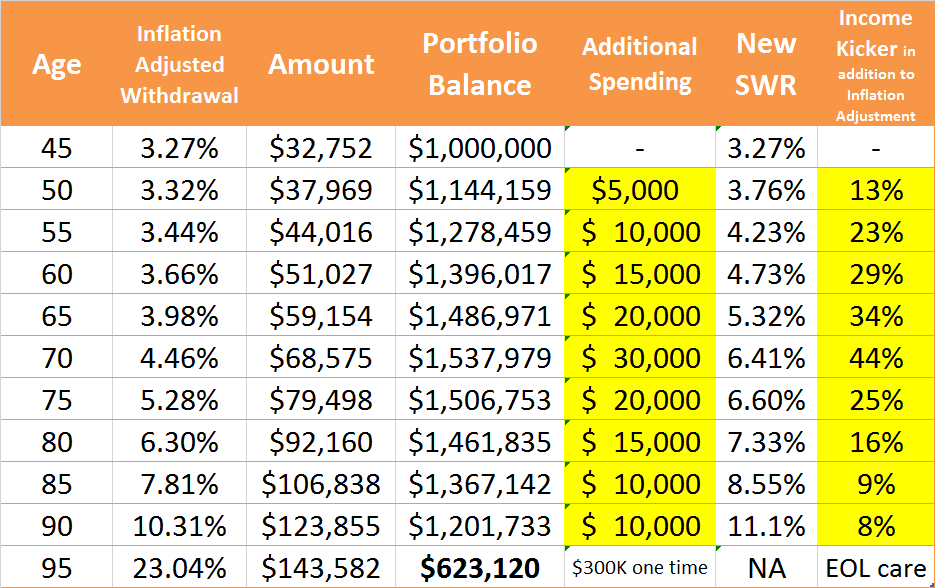
See a different table below that provides for much more happier retirement! The core assumptions are the same as described in the Case above, except the last three columns, which I will explain.
Happy retiree & satisfied heirs?
- The column marked ‘additional spending’ is what our retiree would be able to spend on top of the inflation adjusted raise, every 5 years, based on the portfolio balance.
- The 5-year income kickers start at $5000 at age 50 (which is a significant 13% raise over the inflation-adjusted withdrawal of $37,969 for that year). This once-in-5-years kicker also gets the same 3% inflation adjustment for the subsequent years.
- Notice how the 5-year income kickers increase every 5 years. That’s because our retiree – after checking his steady portfolio growth – can afford to increase spending by the amount mentioned as the ‘additional spending’ for that age. These increases put our retiree on a higher SWR path than what the original SWR would’ve provided for. Remember that we have made a conservative assumption of 6% total return (including dividends) from the portfolio, over the multiple decades of retirement. Still, what makes these income kickers possible every 5 years is the growing portfolio tempered by conservative withdrawals in early years.
- At age 60, our retiree gets a 29% one-time increase over prior year spending to splurge on extended holidays and travel around the world, not to mention lavish gifts for their children and grand children/nieces/nephews and travel frequently to spend time with them. At 65, this gets another $20,000 kicker (that is, 34% raise over age 64 spending) to really do it in style or buy a nicer car or RV.
- At age 70 (presumably the last healthy decade for many retirees), the table provides for the highest ‘income kicker’ amount of $30,000 increase over and above the inflation-adjusted withdrawal. Imagine what this amount could do in your 70’s – world travel in premier class or luxury cruises? Stay in fine hotels with gourmet food? Build a nice college fund for your (hopefully grateful) grand kids? This is the decade to live it up for many people before health issues start to seriously cramp your lifestyle. At 75, this increase gets another $15,000 kicker so you have $45,000 more to spend compared to when you began age 70 with.
- At age 80, our retiree couple may decide to slow down to ponder the deeper meaning of life. They still get a $15,000 kicker (16% increase) over what they spent at age 79. With a lot of world travel behind them, they are probably more into marquee events or donating to charities or even building their legacy as they want it. The extra spending will certainly help towards building a meaningful memory for them. Remember, all this is voluntarily spent based on portfolio balance situation at that age.
- From age 70 onwards, notice how the portfolio balance is declining? That’s a direct result of the new SWR being higher than the assumed portfolio return rate of 6%. So, you are deliberately withdrawing more than what the portfolio is earning annually. If this worries you, remember that at 70, you only have a 25-year horizon remaining in this example. Moreover, you still have a 5-year check on the ‘income kicker’ which can be suitably adjusted downward (or up!) based on your actual portfolio balance at that age. So, instead of $30,000 income kicker, if you choose to take only $15,000 as the additional spending, your portfolio at age 75 will be higher than the $1.5 million shown in the table (for the same 6% total return assumption).
- At ages 85 and 90, while the table still shows a possible incremental spend of $10,000 over prior year’s withdrawal, the choice is again dependent on the health situation or interests of the retiree. Not choosing to add the spending kicker simply allows for a bigger portfolio balance for long-term care and bequests (or) compensate for below 6% total return performance of the portfolio – the best part is, you decide what you want at that age.
- For planning purposes, we assumed 95 as the last year and also, that $300K will be spent that year for end-of-life care. Note that all other medical spending and insurance costs are covered under the withdrawal amounts for the earlier years. This is purely a budgeted terminal care cost figure over and above anything that insurance provides. You can change the figure in both scenarios above if you feel the figure in your case will be different.
- Notice how this happy retiree has spent most of retirement enjoying comforts and experiencing a better lifestyle than the scenario 1 retiree. Yet, they still leave behind over $600,000 in legacy for heirs or as bequest to charity. While this is far lower than the nearly $3 million our Scenario 1 retiree leaves behind, $600K+ is still a substantial sum of money that can pay for either a house in full or pad up the retirement fund of your children or grand children.
- What enables a great retirement in Scenario 2 is the 5-year review informed by actual market performance, which is supported by a sensible withdrawal strategy that is conservative to begin with and loosens up as the portfolio’s reality shows better than your worse case analysis.
This model is still very conservative because it ignores a key research finding about actual spending patterns of older people.
“Household expenses steadily decline with age. With the age 65 expenditure as a benchmark, household expenditure falls by 19 percent by age 75, 34 percent by age 85, and 52 percent by age 95.”
Expenditure Patterns of Older Americans, 2001-2009, S. Banerjee (EBRI Issue Brief, 02/2012).
So, there is enormous cushion in the assumption of increasing ‘income kickers’ every 5 years!
Most importantly, Scenario 2 avoids the 40% group of folks in the Bloomberg article who are likely to have deep regret of having been too conservative throughout their retired life and as a result, having an enormous portfolio at an advanced age when their ability to spend on fun things or beautiful experiences is greatly diminished. The Scenario 2 retiree has spent an additional $675,000 over the 45 years of retirement compared to Scenario 1 retiree, due to the 5-year ‘income kickers’, which is tuned to portfolio performance and age.
I would bet that this retiree is much less likely to have regret than Scenario 1.
I have learned a lot doing this analysis, as I hope you have in reading it. I am now thinking about how to bring Scenario 2 into practice in my own life as I intend to start with 3.27% SWR and so, may end up with Scenario 1 based on my net worth profile.
What do you think? Do you want to be in Scenario 1 as mainstream financial planners want you to be or do you prefer to follow Scenario 2 and have a great retired life?
Raman Venkatesh is the founder of Ten Factorial Rocks. Raman is a ‘Gen X’ corporate executive in his mid 40’s. In addition to having a Ph.D. in engineering, he has worked in almost all continents of the world. Ten Factorial Rocks (TFR) was created to chronicle his journey towards retirement while sharing his views on the absurdities and pitfalls along the way. The name was taken from the mathematical function 10! (ten factorial) which is equal to 10 x 9 x 8 x 7 x 6 x 5 x 4 x 3 x 2 x 1 = 3,628,800.
12 comments on “Live It Up in Retirement!”